Visualising HMG
Mapping the UK Government
I thought it would be interesting to map out the British Government - partly to get my head round the intricacies of the between 614+ departments, ALBs, public corporations and more, but also as a foundation to map cyber security environment of the same. Jump straight to the map here.
Getting started
Thanks to the British taxpayer, there are many useful resources to get started with. This began with the gov.uk api, which returns a breakdown of organisation parent/child relationships as well as the associated domain.
Interestingly, about half of all domains are not the centrally managed .gov.uk domains, meaning a casual glance across a leaksite or credential dump might not suggest any link to the British Government. The inconspicuous uknnl.com, for example, is the UK National Nuclear Laboratory, and probably worth attention.
Initial processing
Having pulled the full dataset down, the first step was to filter out orgs that no longer exist. The department list includes organisations that are live, closed, exempt, joining or transitioning. Of these, it seemed reasonable to cut closed organisations from the scope, though retain the transitioning and joining group, which include significant organisations (i.e. FCDO Services), but which are not on the gov.uk organisations page.
Mapping the parent/child relationships tested some of my assumptions, and a number of entities have multiple parent organisations. The Labour Market Evidence Group came top with five ‘parent’ organisations. This appears to reflect entities that are a collaborative effort, or that sit across devolved governments:
ORG: National Cyber Force
Type: Sub organisation
Parents (4):
  - Ministry of Defence
  - Defence Science and Technology Laboratory
  - Secret Intelligence Service
  - Government Communications Headquarters

ORG: Animal and Plant Health Agency
Type: Executive agency
Parents (3):
  - Department for Environment, Food & Rural Affairs
  - Welsh Government
  - The Scottish Government
I decided that the gov.uk team had thought this through and had a good reason to put the Parent organisations into that order (based off the one data point of ‘well it isn’t alphabetical’). Having made the brave decision to not do anything, I simply used the first in the list for the 45 entities with multiple parents.
From here, data enrichment began in earnest. Linking across to non-gov.uk domains was easy (given the predictable structure - thanks again GovUK design team). Next up was providing some level of scale to the data for a visualisation.
Scaling by size
The ‘OSCAR II’ public spending database offers an aggregate of government entity spending, minus data for security, intelligence and military operations.
The first step was to filter OSCAR II data down to DEL ADMIN (Delegated administrative expenditure) and DEL PROG (Program expenditure). Negative values are present in the data indicating return on investment, self funding regulators or similar. By using these values we seek to reflect the scale of an entity, rather than cost to the taxpayer. As such, the values look large and can dwarf the ‘actual’ budget.
There are some notable values - such as the British Museum, which received a payment and immediate deduction of £917m. Assuming this is an admin error, rather than the UK Government laundering money through museums, this nevertheless plays merry hell with the data. However, as the alternative is government departments with budgets of negative millions, this approach appears most appropriate.
Aligning OSCAR II data with the Gov API data was a challenge, and largely - but not perfectly - helped with a fuzzy match, followed a score-review to make sure each org was only matched a maximum of once.
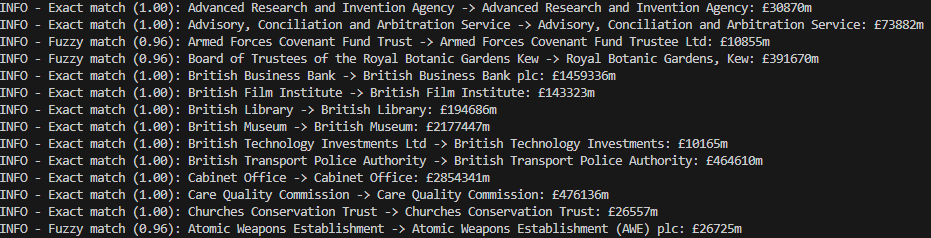 Please ignore the unit error
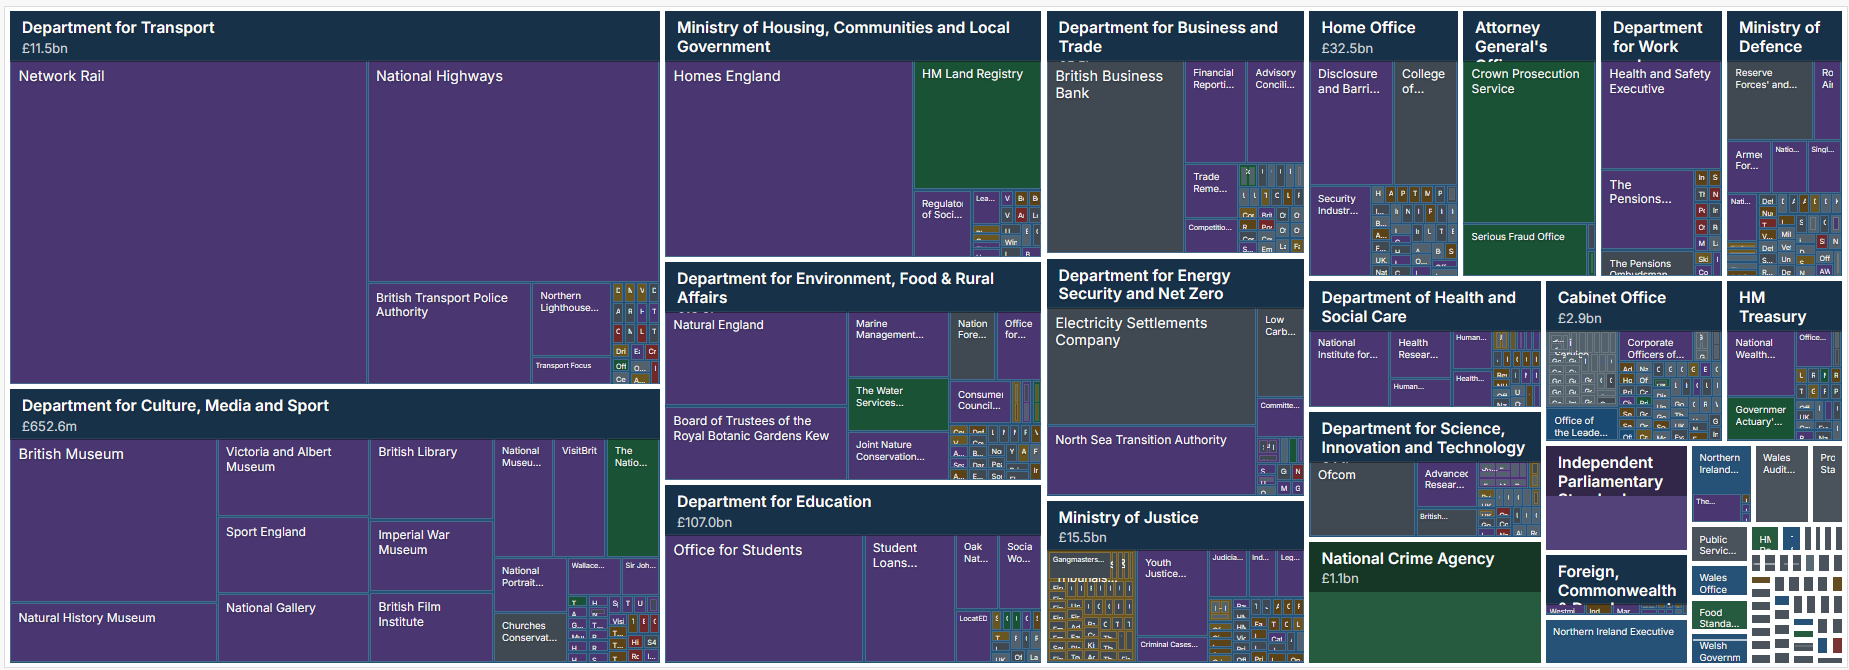
It was then trivial to generate a tree map broadly representing the structure of HMG, weighted by the gross budget value. With a little orchestration, LLMs are incredibly competent at data visualisation.
This gives a tree map showing the size, depending on both the gross budget of the organisation, and that of related subsidiary entities. The leaf ‘Department for Transport’, for example, is significantly larger than the better budgeted Ministry of Defence, because: (a.) it contains National Rail which has very high running costs; though offset in reality by income, which our approach ignores and; (b.) as above, some heavy hitting items related to Defence are not shown in the OSCAR II data.
A finished product
The resulting mapping does a good job of balancing legibility with the complexity of the estate. The next steps will be to enrich this with actionable data.